3. History
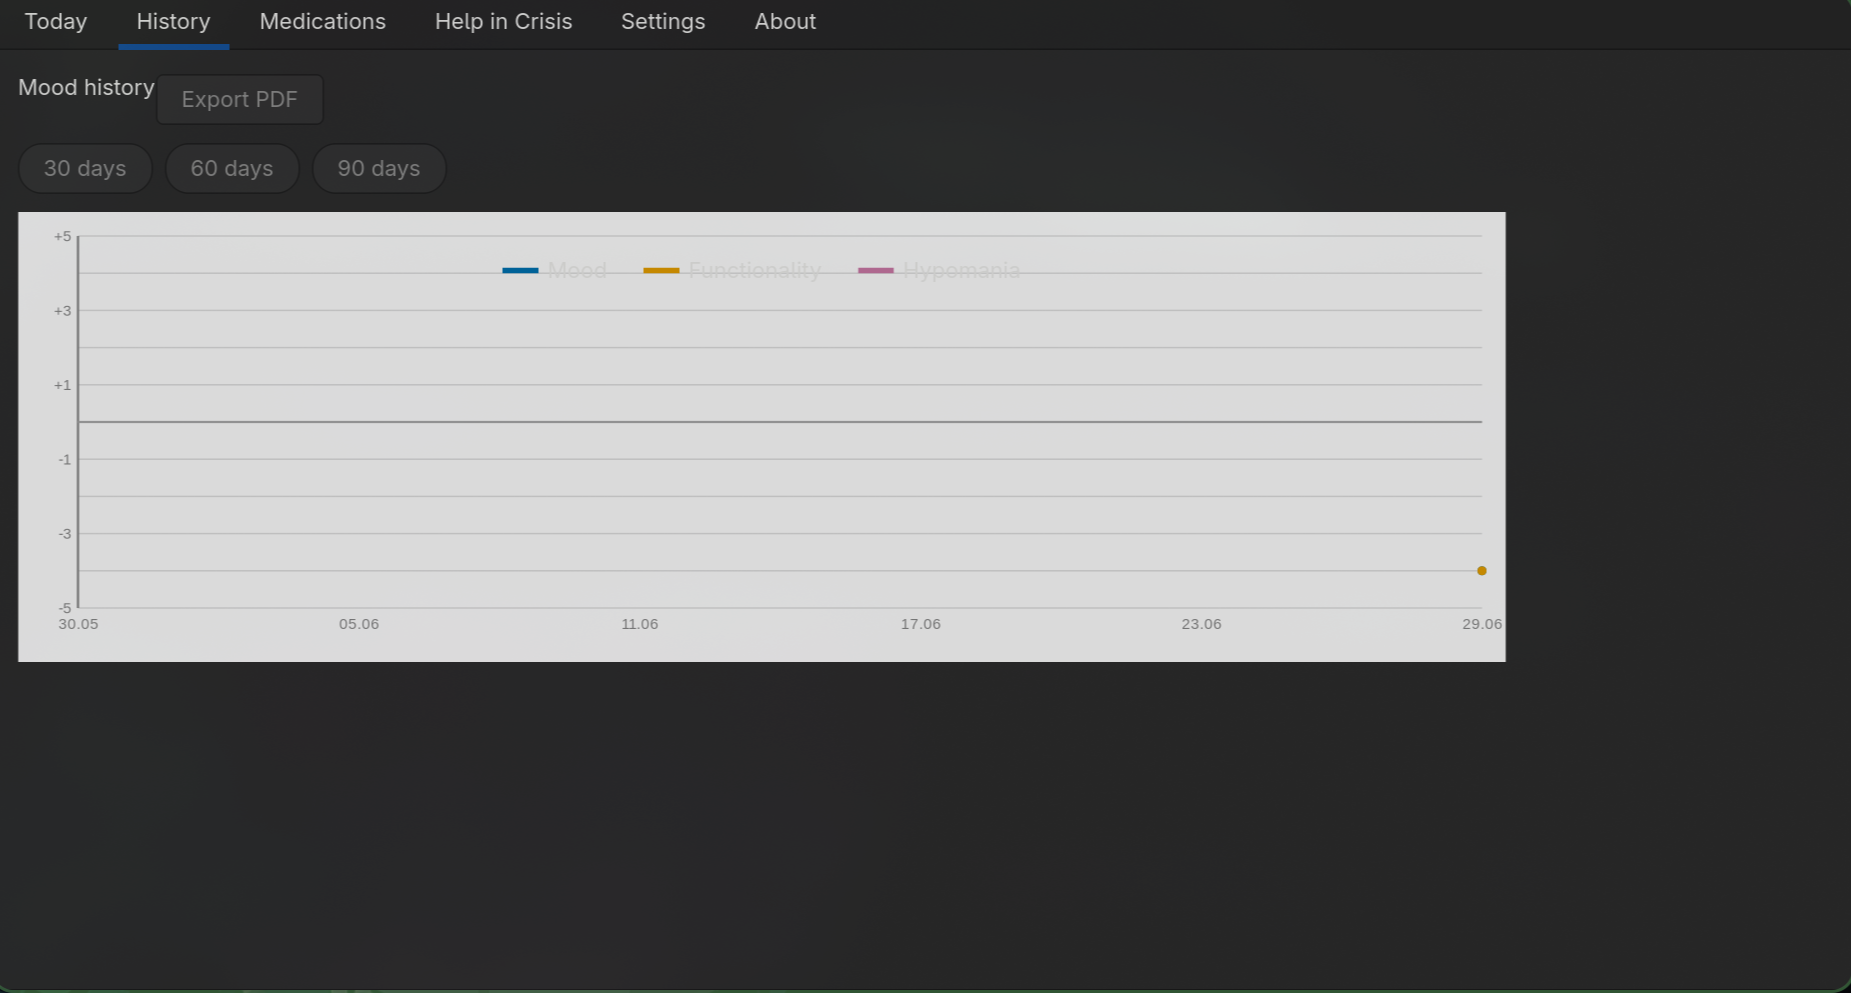
Open the "History" tab to see your mood and functionality over time.
Choosing a Time Range
Use the 30, 60, and 90 buttons to select how many past days to display. The currently active range is highlighted in blue.
Reading the Chart
| Colour | Meaning |
|---|---|
Blue (#0072B2) |
Mood |
Amber (#E69F00) |
Functionality |
Purple (#CC79A7) |
Hypomania marker |
- The Y-axis shows the scale from −5 to +5.
- The X-axis shows dates (approximately 5 evenly spaced labels).
- Purple markers appear as a vertical band with a diamond dot at the top on days where "Hypomania" was enabled.
- If there are no entries for the selected period, an informational message is displayed instead.
PDF Export
Tap "Export PDF" to generate a progress report.
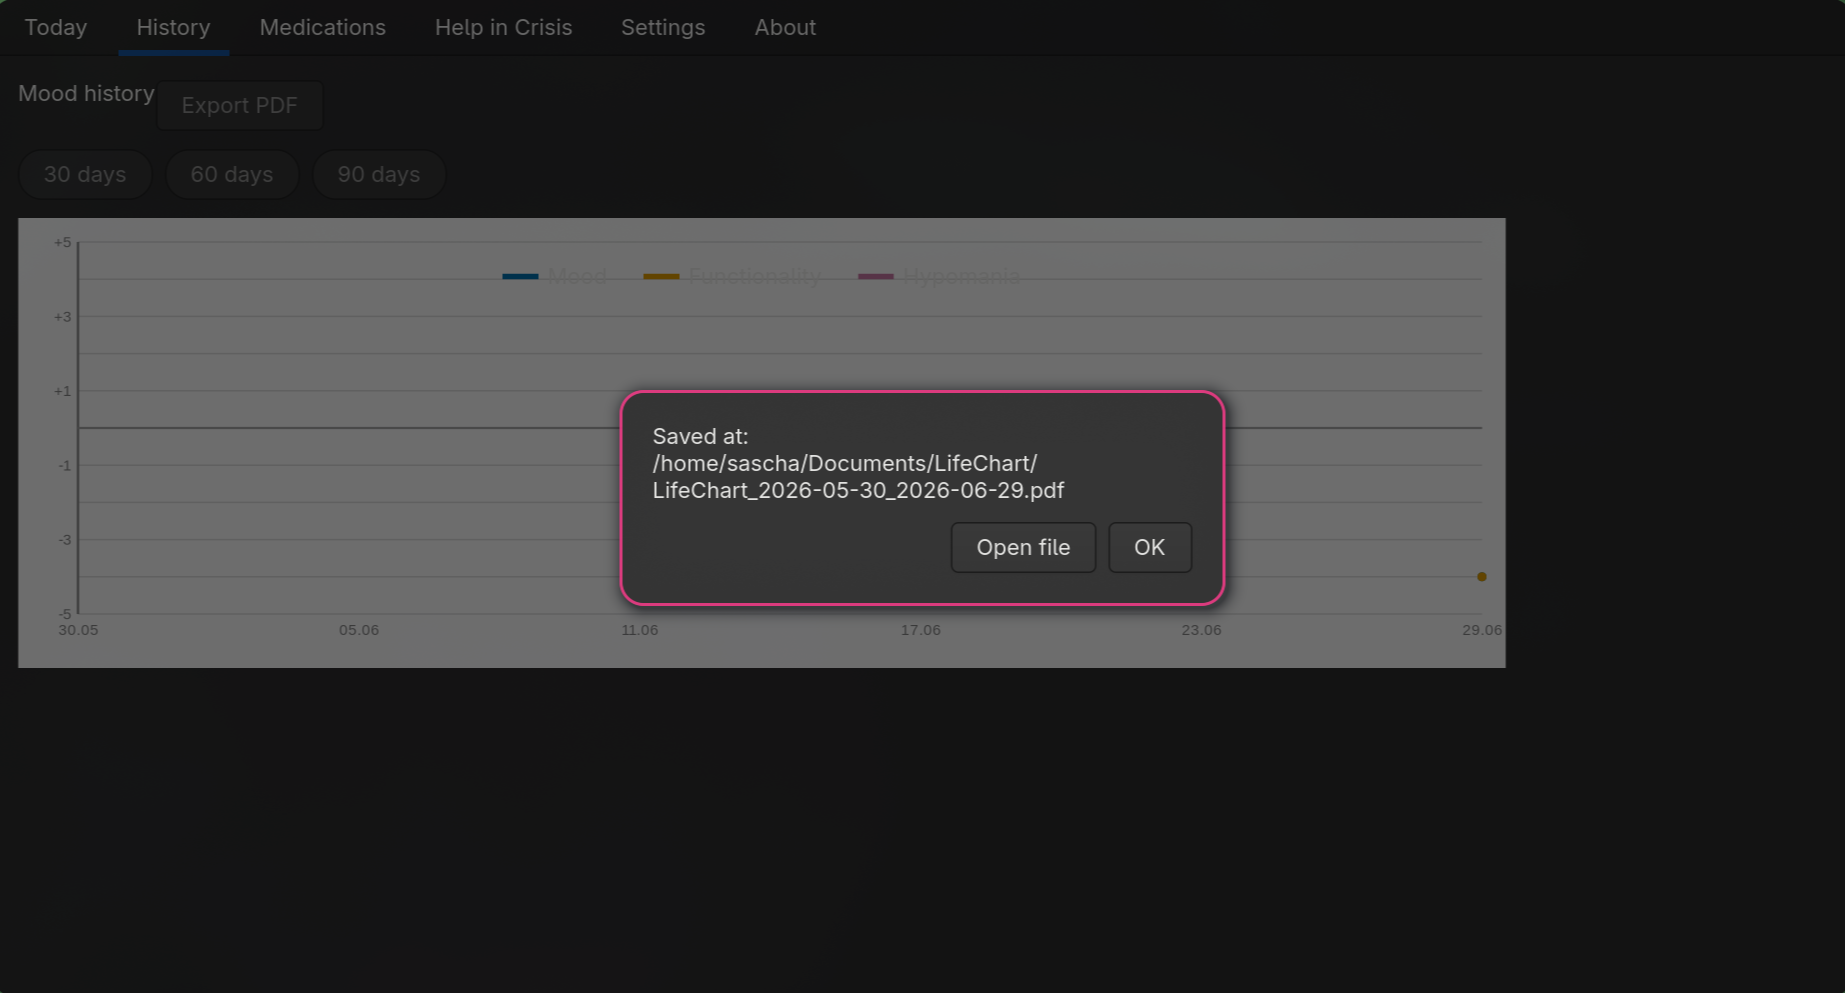
The PDF is saved to ~/Documents/LifeChart/ (filename: LifeChart_YYYY-MM-DD_YYYY-MM-DD.pdf). After saving, LifeChart asks whether you want to open the file immediately.
Note: A PDF viewer must be installed to open the file.